Once your course is live, this page shows enrollments, completion rates, learner feedback, and revenue.
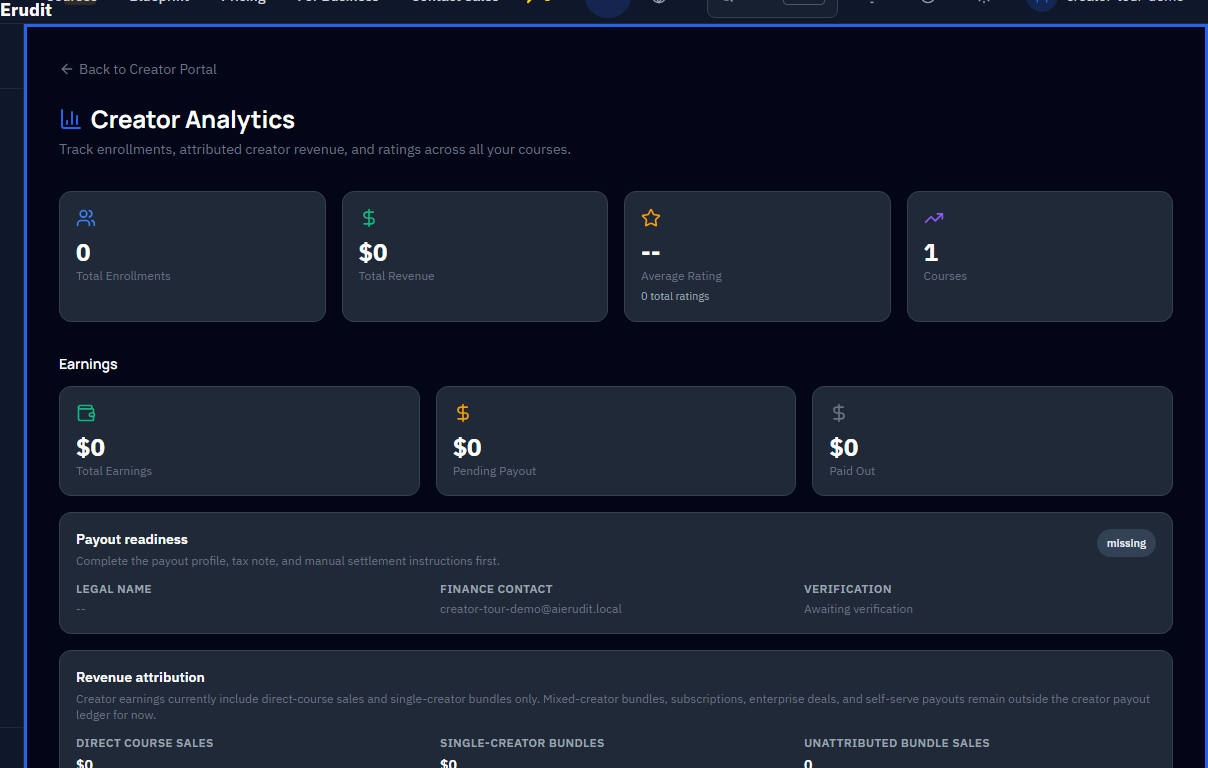
Key metrics
The analytics dashboard tracks:
- Enrollments -- how many learners have started your course.
- Completion rate -- the percentage of enrolled learners who finish all modules.
- Learner feedback -- ratings and comments from learners who completed the course.
- Revenue -- earnings from paid enrollments, net of refunds and platform fees.
First 30 days
In the first 30 days, focus on completion rate and feedback -- enrollment numbers are noisy at low volume. Treat the first month as a quality calibration period.
If completion rate is low, review the modules where learners drop off. Common causes:
- A module is too long or covers too many concepts.
- An exercise is unclear or has a confusing solution.
- The difficulty ramp is too steep between consecutive modules.
Ongoing improvement
Use feedback to iterate:
- Update modules based on common learner questions.
- Add hints or additional context where learners struggle.
- Keep the course current as tools and best practices evolve.